Wage Rate and Growth
lfs_toronto = labourforce.dataframe(cma="Toronto")
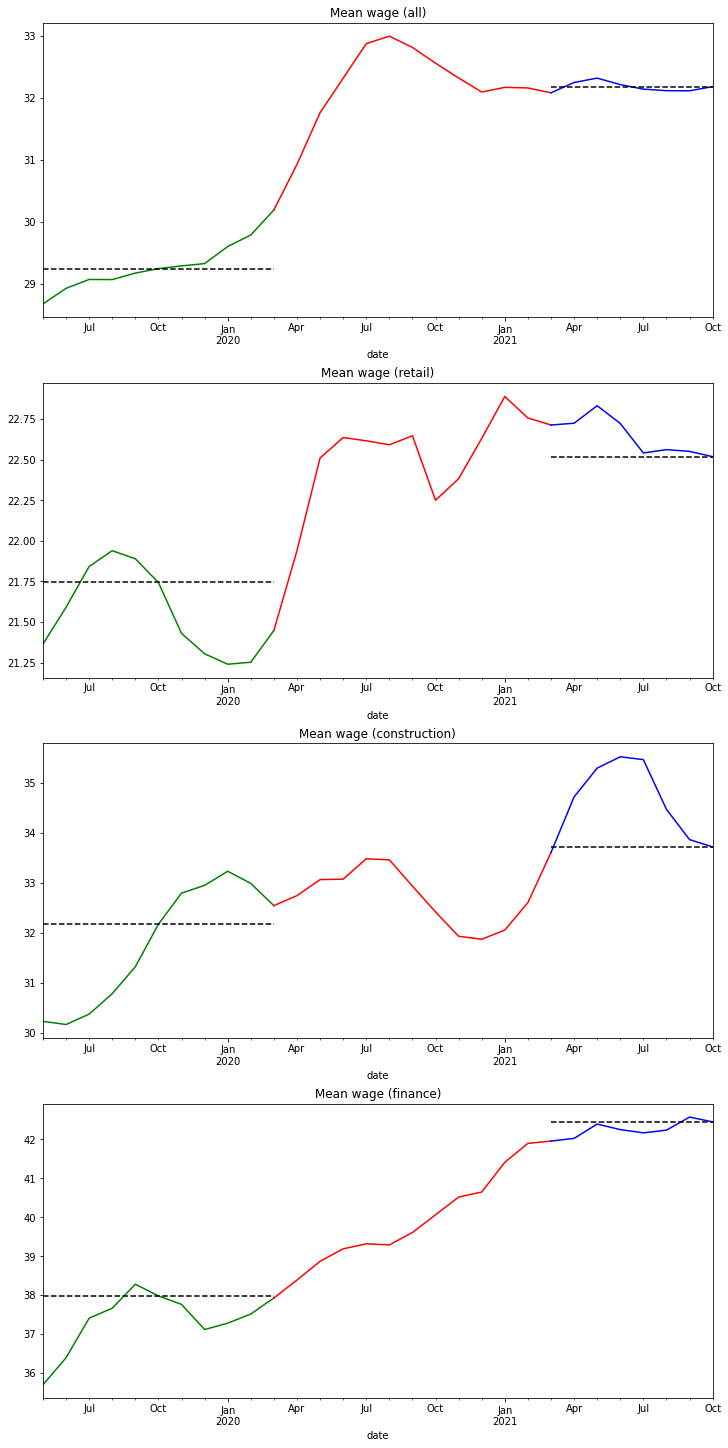
Wage increase over the COVID pandemic
industries = ['all', 'retail', 'construction', 'finance']

(fig, axes) = pl.subplots(len(industries), 1, figsize=(10, 5 * len(industries)), constrained_layout=True)

for (i, industry) in enumerate(industries):
    df = wage_by_industry(industry)
    plot1(df, axes[i], industry)
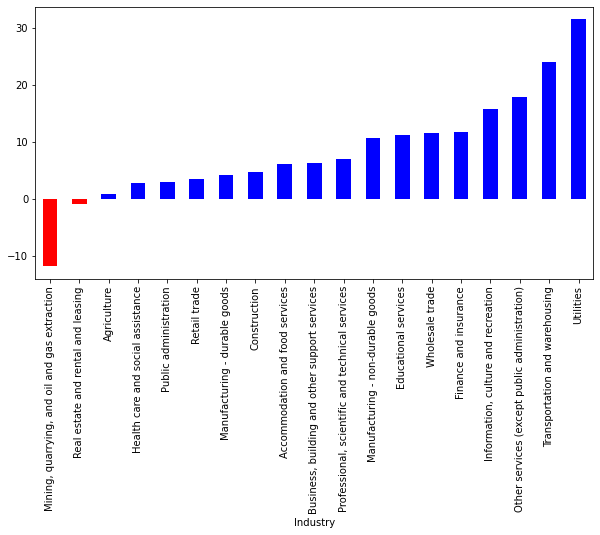
Wage increase by industries
df = lfs_toronto[['date', 'naics_21', 'hrlyearn']].dropna()
df = df.groupby(['date', 'naics_21']).mean().reset_index().set_index('date')
df = df.pivot(columns='naics_21').rolling(5).mean().iloc[4:].transpose()
df = df[['2019-10-01', '2021-10-01']]
df.columns = ['pre', 'post']
df['increase'] = (df['post'] / df['pre'] - 1.)*100
df.sort_values(by='increase', inplace=True)
df = df.reset_index(level=0, drop=True)
df.index.name = 'Industry'
df.dropna(inplace=True)
df
| pre | post | increase | |
|---|---|---|---|
| Industry | |||
| Mining, quarrying, and oil and gas extraction | 45.985700 | 40.559167 | -11.800480 |
| Real estate and rental and leasing | 26.998493 | 26.756227 | -0.897332 |
| Agriculture | 23.157450 | 23.344000 | 0.805572 |
| Health care and social assistance | 28.854486 | 29.658342 | 2.785897 |
| Public administration | 39.068808 | 40.230837 | 2.974313 |
| Retail trade | 21.743701 | 22.518379 | 3.562772 |
| Manufacturing - durable goods | 29.341269 | 30.597574 | 4.281700 |
| Construction | 32.175108 | 33.720906 | 4.804328 |
| Accommodation and food services | 17.456831 | 18.529793 | 6.146369 |
| Business, building and other support services | 23.073824 | 24.530739 | 6.314146 |
| Professional, scientific and technical services | 36.146100 | 38.708048 | 7.087758 |
| Manufacturing - non-durable goods | 26.684284 | 29.536928 | 10.690351 |
| Educational services | 35.121274 | 39.072096 | 11.249085 |
| Wholesale trade | 29.159620 | 32.508170 | 11.483517 |
| Finance and insurance | 37.979653 | 42.449050 | 11.767872 |
| Information, culture and recreation | 28.247628 | 32.716910 | 15.821797 |
| Other services (except public administration) | 24.083483 | 28.405582 | 17.946321 |
| Transportation and warehousing | 25.966828 | 32.211410 | 24.048305 |
| Utilities | 39.799617 | 52.341370 | 31.512246 |
s = df['increase']
color = pd.Series('', index=df.index)
color[s < 0] = 'red'
color[s >=0] = 'blue'
pl.figure(figsize=(10, 5))
ax = pl.gca()
df.increase.plot.bar(ax=ax, color=color);